Manuel's Portfolio
Northern VA — Information Systems & Technology
Open to full-time roles

Junior
Manuel
Mercado-Hernandez

Do. Or do not. There is no try.

Tools in production
2
Transcripts analyzed
~135,000
AI models created
2
Languages
EN / ES
01

Things I built

03 shipped

PRAXIS

AI training agent · Podium Education · 2025
TOOL_01

Advisor training ran on instinct, so I built an AI agent that turns 135,000 analyzed call transcripts into live, adaptive practice scenarios — now in daily use.

Advisor training ran on instinct. Nobody had actually measured what separated a strong call from a weak one. I analyzed roughly 135,000 call transcripts to find which behaviors correlated with funnel movement across a full summer cycle, then codified the results into a scoring rubric advisors could train against.

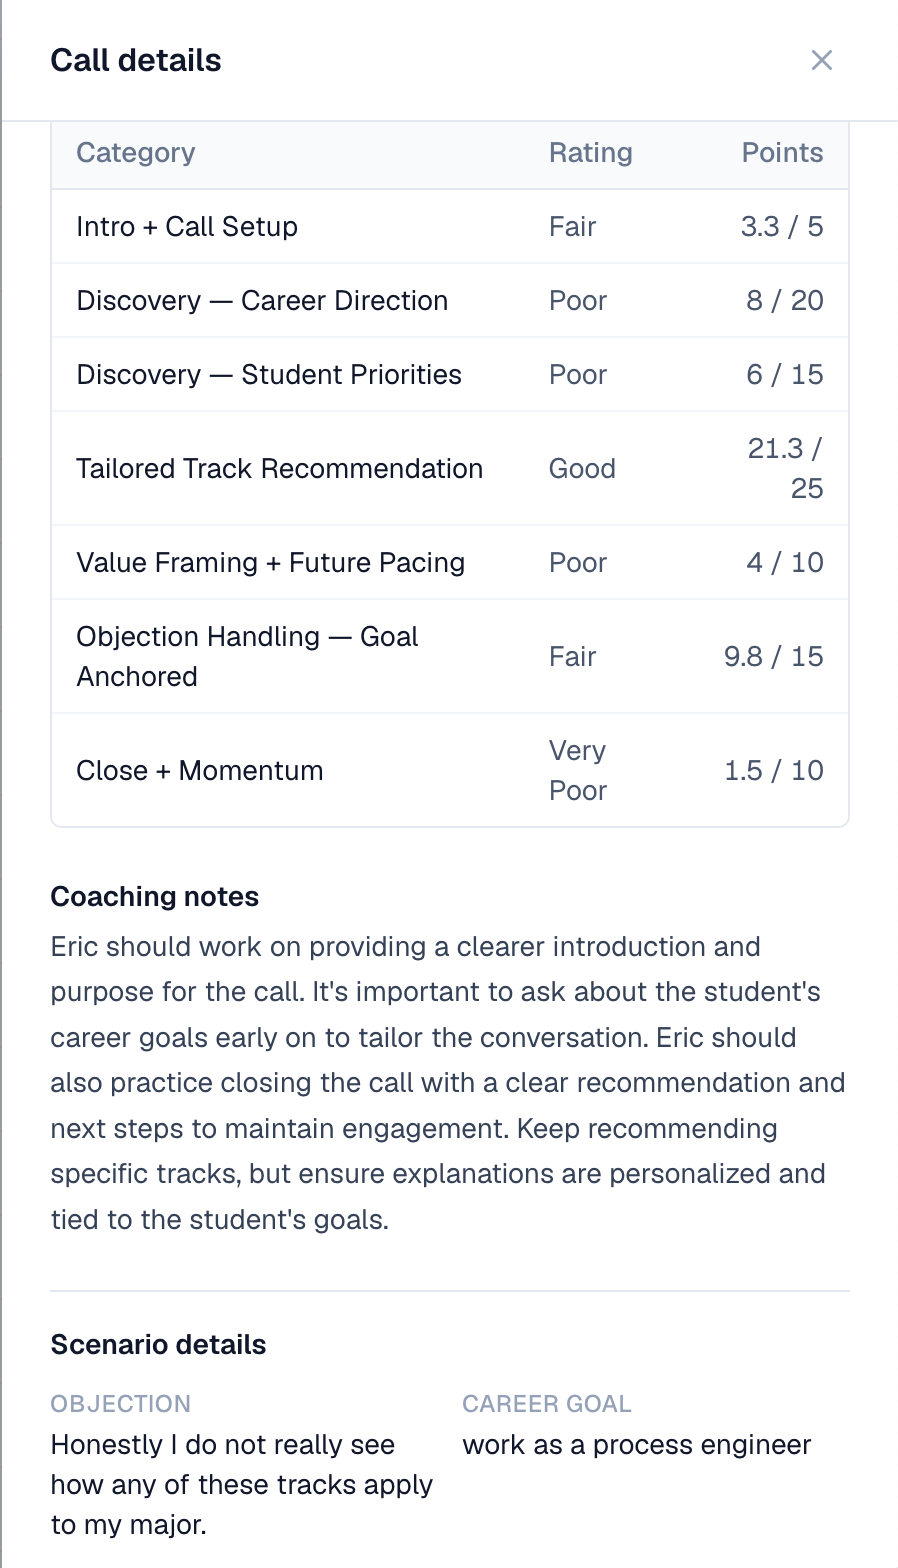
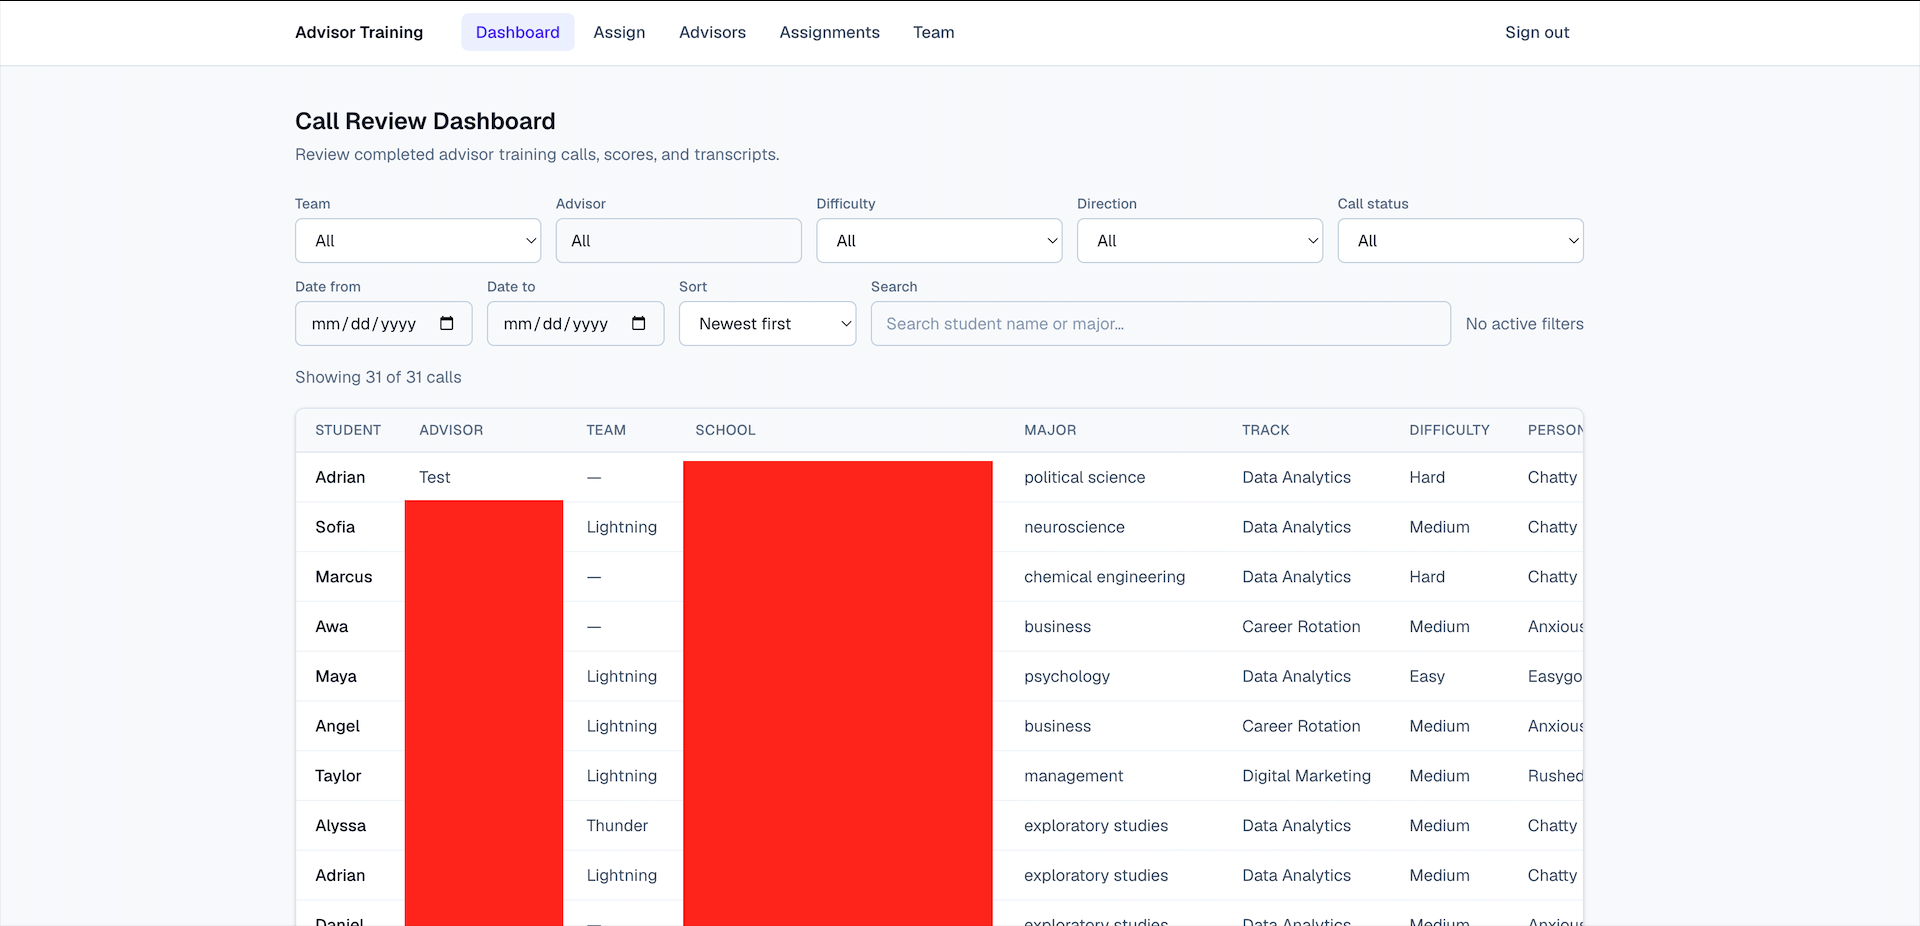
PRAXIS puts that rubric to work. Admins assign a scenario, and the tool simulates live Salesforce navigation against AI-generated students who vary in difficulty and personality — chatty, anxious, blunt — across situations like registration issues and scheduling conflicts. Advisors rehearse intros, discovery, track recommendations, value framing, and objection handling against something that responds like a real caller, before they're ever on the line with one.
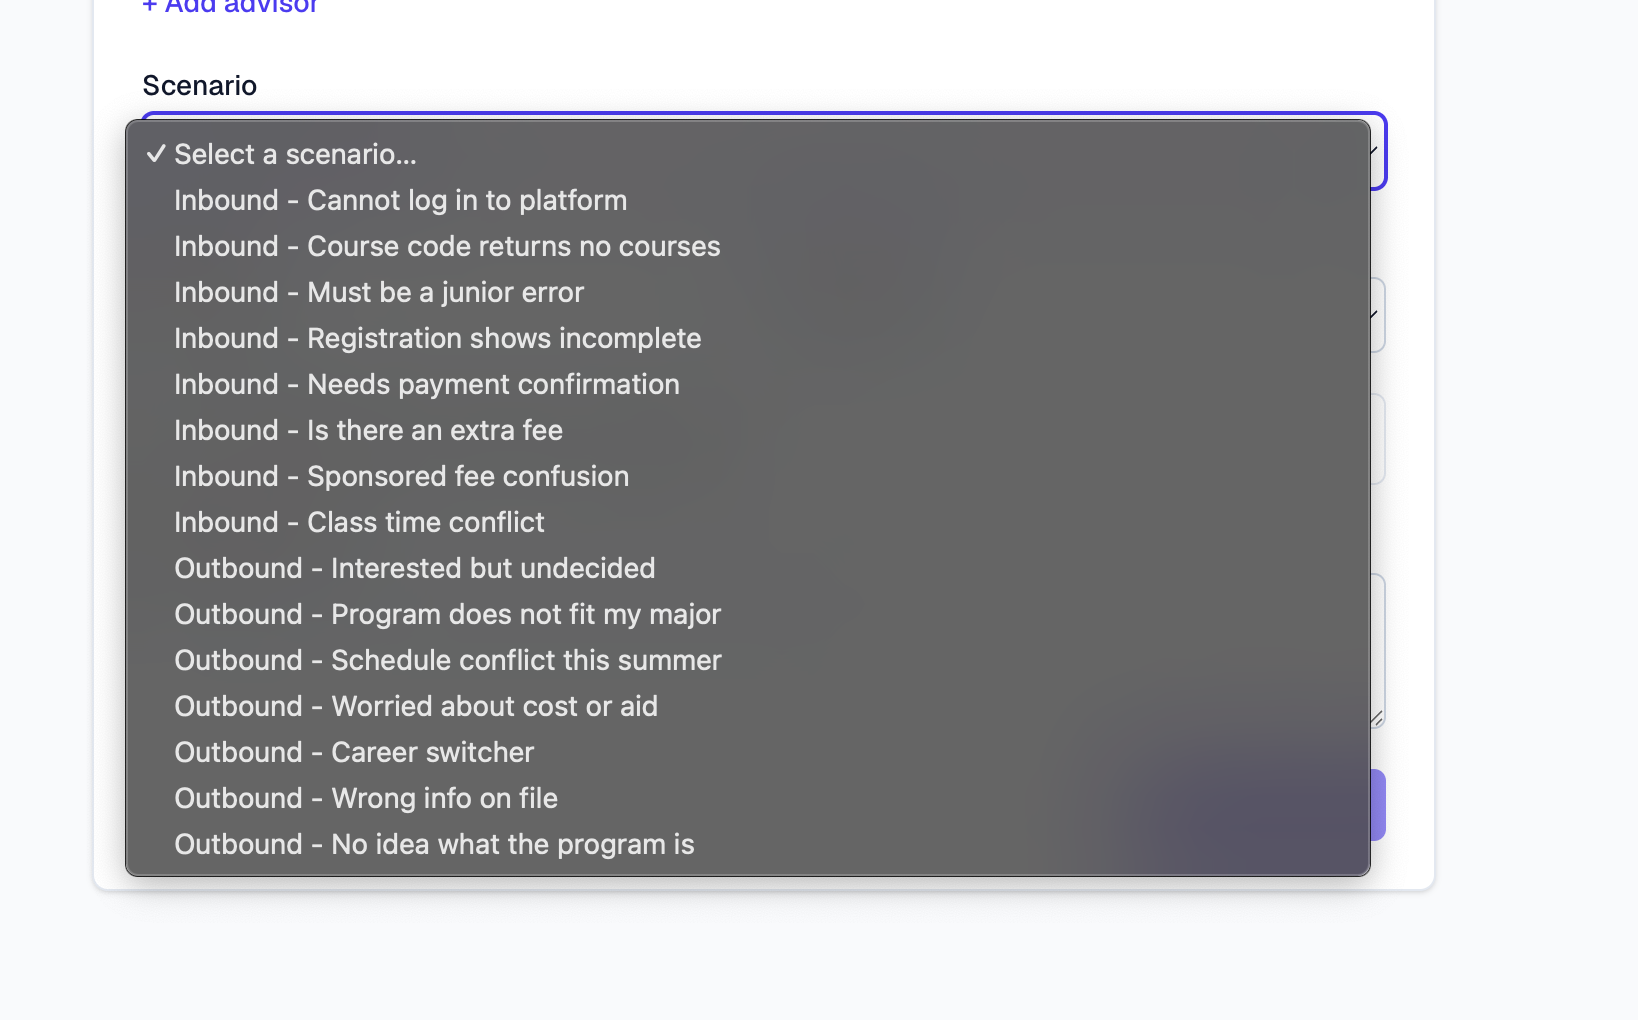
Corpus
~135,000
Rubric basis
Funnel movement
Simulates
Salesforce UI
Status
In use
PythonTranscript analysisSalesforceThoughtlyLLM toolingScenario design

Trubbish

Environment automation · Podium Education · 2025
TOOL_02

A registration data environment that took hours to clean by hand now clears itself automatically on a schedule.

The registration data environment had turned into a junk drawer. Clearing processed files meant deleting them one at a time — hours of work for a thousand-plus records — so it rarely happened, and stale files quietly degraded every run that came after.

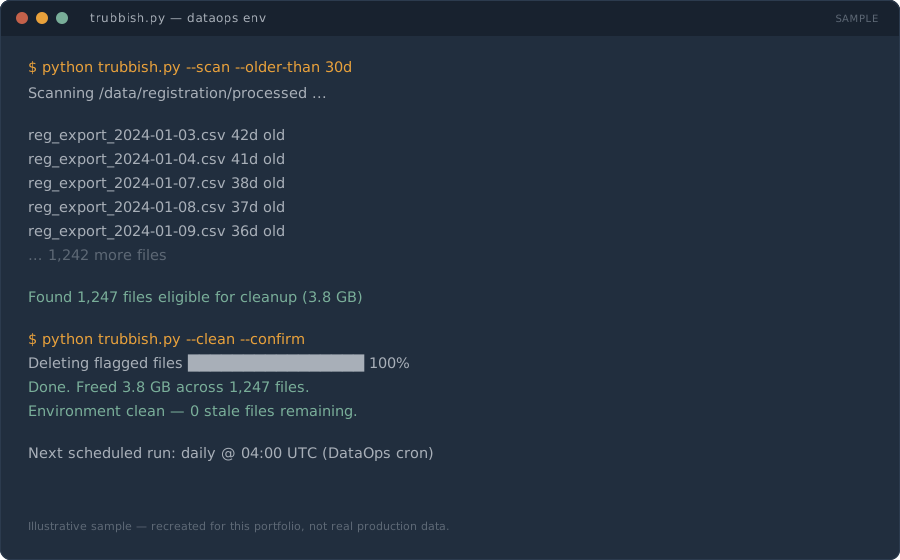
Trubbish scans for aged, already-processed files and clears them automatically. DataOps runs it on a set cadence now, so the environment stays a workspace instead of a landfill, and every downstream operation runs against clean data by default.

Records/run
1,000+
Before
Hours, manual
After
Scheduled
Owner
DataOps
Sample Trubbish terminal output (recreated for this portfolio, not real production data)
Illustrative sample terminal output
PythonJupyterHubScheduled jobsData hygieneETL

Premier League Predictor

Sports analytics · Personal project · 2026
TOOL_03

A live app that simulates the Premier League title race 20,000 times and projects player stats from 33 seasons of history.

Football punditry runs on gut feel. I wanted to see how far 33 seasons of match history and live Fantasy Premier League data could get toward an actual answer — who wins the title, and what each player is worth on the pitch, broken down by position.

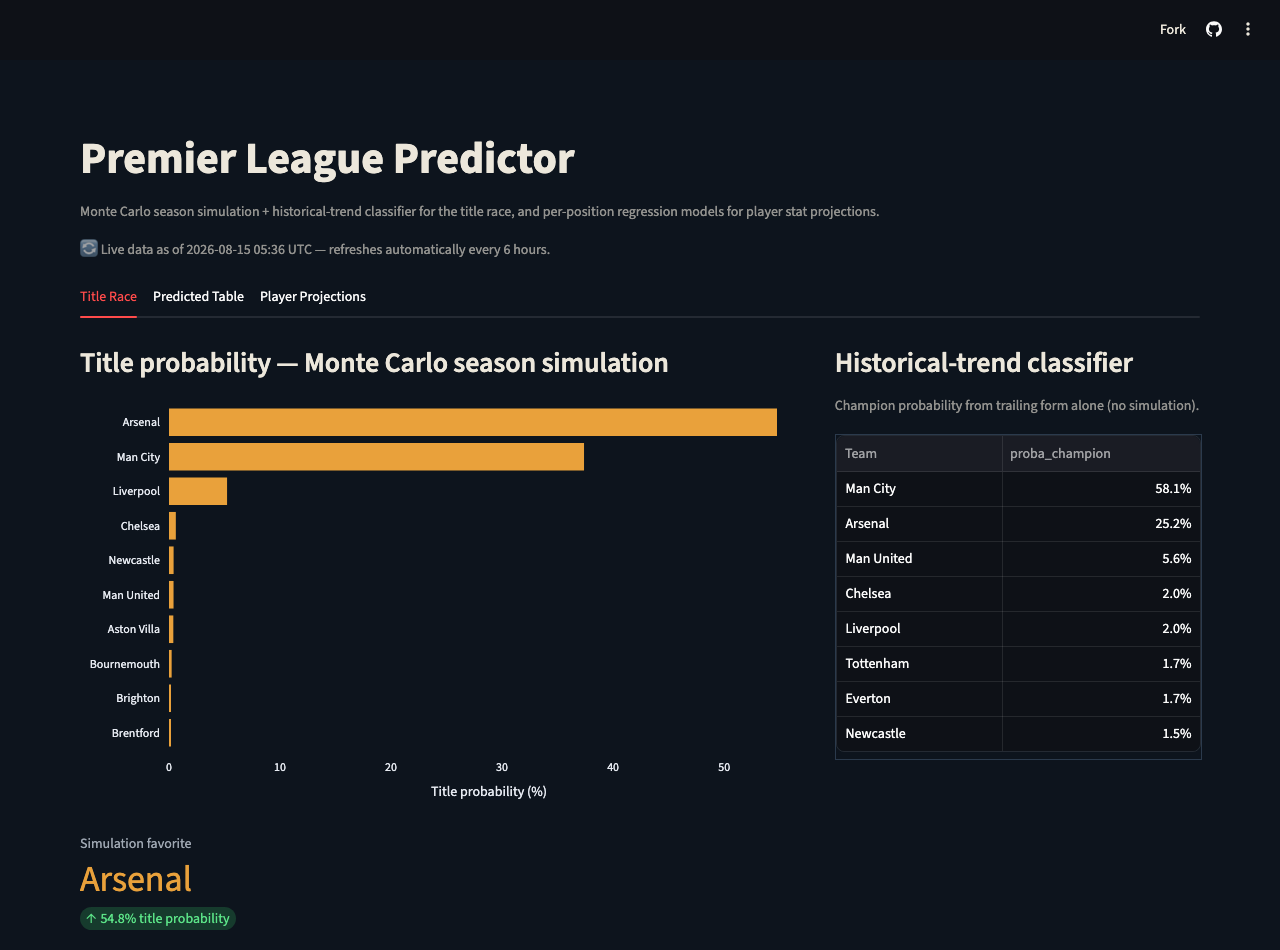
Two independent models triangulate the title race: a Poisson attack/defense model simulating the season 20,000 times, and a gradient-boosted classifier trained on three decades of trailing form. Per-position regressors (goalkeeper, defender, midfielder, forward) project next-season stats — goals, assists, clean sheets, saves — from each player's FPL history. The whole thing recomputes live from the FPL API on a 6-hour cache, backed by a nightly GitHub Action that keeps the underlying match history current.

Seasons trained
33 (1993–2026)
Simulations/run
20,000
Positions modeled
4
Data refresh
Live, every 6h
Premier League Predictor dashboard — title probability chart and historical-trend classifier table
Live app: title-race probability dashboard
PythonStreamlitscikit-learnstatsmodelsPandasPoisson regressionGitHub ActionsFPL API
02

Analysis work

07 projects

Chipotle Electric Fleet Strategy 1st place

Capstone · MGMT 434 Strategic Management · VCU · Apr 2025
PROJ_01

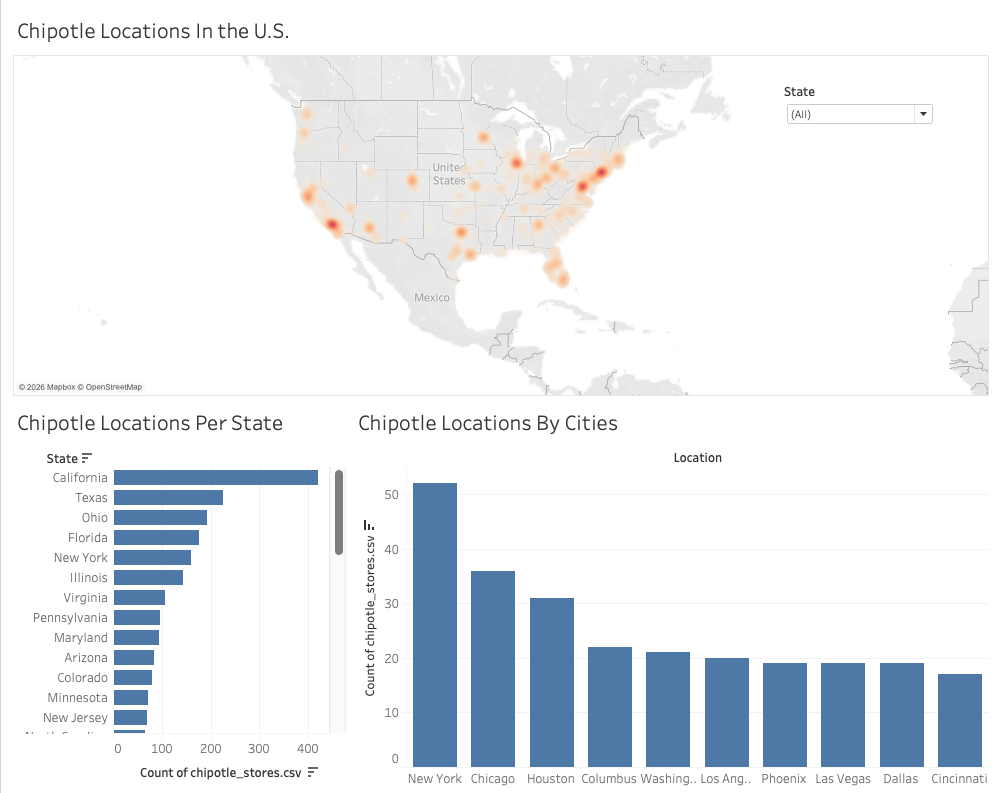
1st-place capstone: proved a Chipotle electric food-truck fleet could hit $8M+ NPV and a 3.73-year payback across a five-year rollout.

Five-person capstone team, one question: how could Chipotle enter underserved and high-traffic markets without the cost and risk of new brick-and-mortar builds? Our answer was a fleet of custom electric food trucks built in partnership with Workhorse — and it was on me to prove the math held up.

I owned the data and financial modeling: a base of 3,900+ Chipotle locations, historical charging-station build costs from a DOE cost study, labor at real wage rates, permits, and the $40,000 federal EV incentive Workhorse guarantees per vehicle. All-in cost landed at just under $317,000 per truck, charging infrastructure and kitchen equipment included.

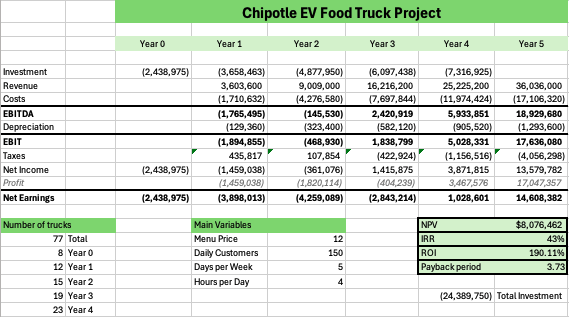
The model projected $8M+ NPV, 43% IRR, roughly 190% ROI, and a 3.73-year payback across a five-year rollout: pilot 8 trucks in Los Angeles, optimize routes and hit 10,000 customer interactions in Year 2, go bicoastal into Washington D.C. in Year 3, layer in catering and live truck tracking in Year 4, then enter New York City in Year 5 — 77 vehicles and $24.4M invested, with roughly $14.6M in net earnings by Year 5.

Strategic grounding came from Porter's Five Forces, VRIO, and a value chain analysis of Chipotle's positioning against a saturated fast-casual market. The ESG case carried real weight: lower emissions and overhead, plus improved food access in underserved communities where the trucks double as brand ambassadors.

NPV
$8M+
IRR
43%
Payback
3.73 yrs
Fleet by Yr 5
77 trucks
Financial modelingNPV / IRRExcelPorter's Five ForcesVRIOValue chainESG

Financial Advisor Chatbot

Multi-agent AI system · INFO 452 AI Services For Business · VCU · May 2025
PROJ_02

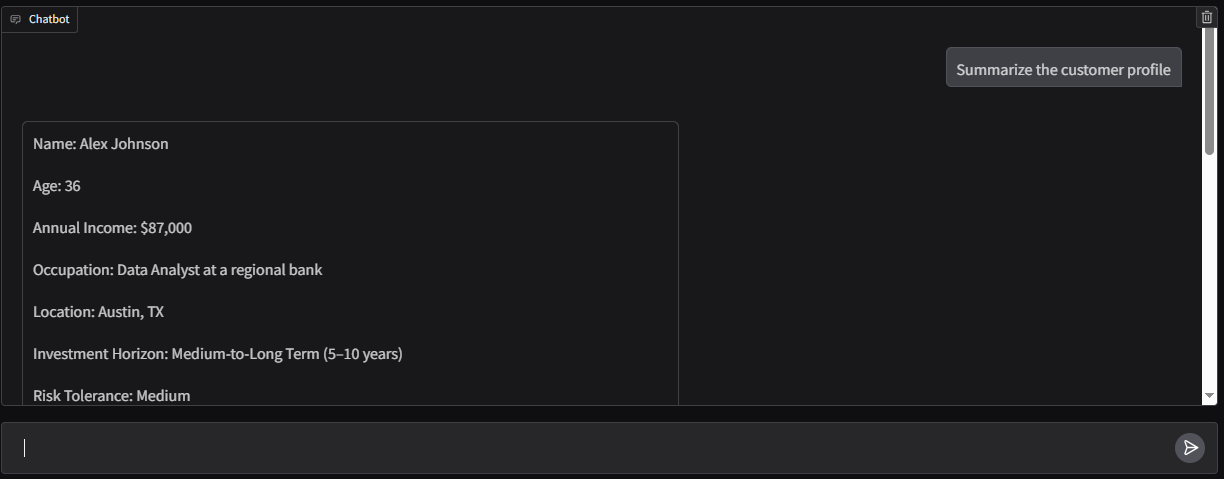
A multi-agent AI system that profiles a user, plans an investment strategy, and hands back a client-ready report — I designed the agent architecture.

Four-person team, three-part build across a semester: prompt engineering, then retrieval-augmented generation, then a full multi-agent system. The brief was a financial advisor chatbot — profile a user, plan a strategy, recommend specific assets, and hand back a report that reads like it came from an actual advisor.

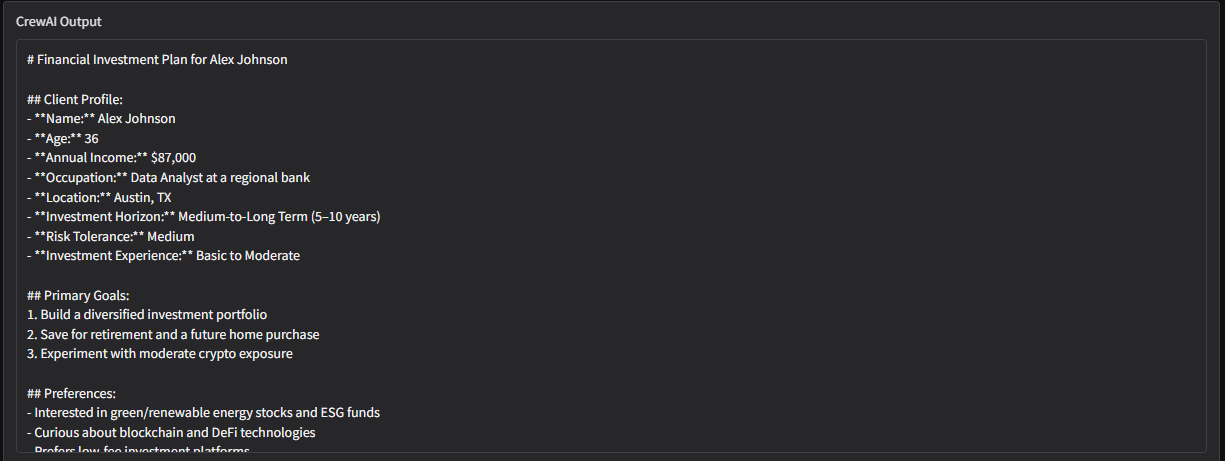
I designed and built the agent architecture in CrewAI: a Profile Analyzer Agent that structures the user's financial picture, an Investment Strategy Planner Agent grounded via RAG in SEC and investing-guide documents, a Market Analyst Agent pulling live pricing through yfinance and Serper, and a Report Generator Agent that compiles it all into a client-ready markdown report — coordinated by a hierarchical manager agent that delegates tasks rather than running a fixed pipeline.

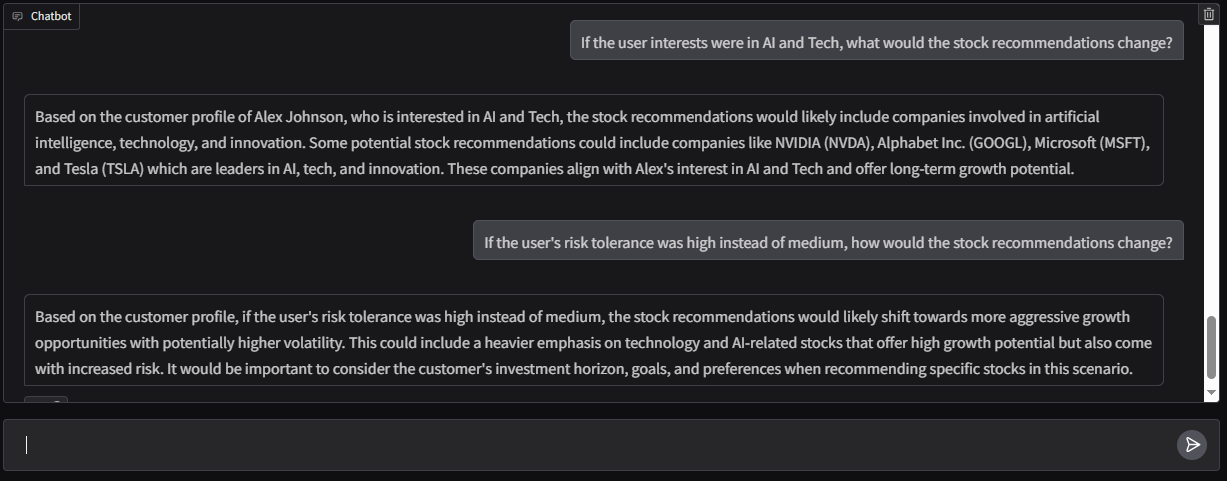
A conversational Chatbot Agent sits on top for follow-up questions. Ask how the recommendations change if a user's risk tolerance shifts from medium to high, or their interests shift toward AI and tech, and it re-reasons from the same profile instead of starting over.

Agents
5
Framework
CrewAI, hierarchical
Live data
yfinance + Serper
Output
Client-ready report
PythonCrewAIGPT-3.5-turboRAGyfinanceSerper APIWeb scrapingGoogle Colab

U.S. Energy Market Analysis

Client: Intel Sustainability · VCU · Jan–May 2024
PROJ_03

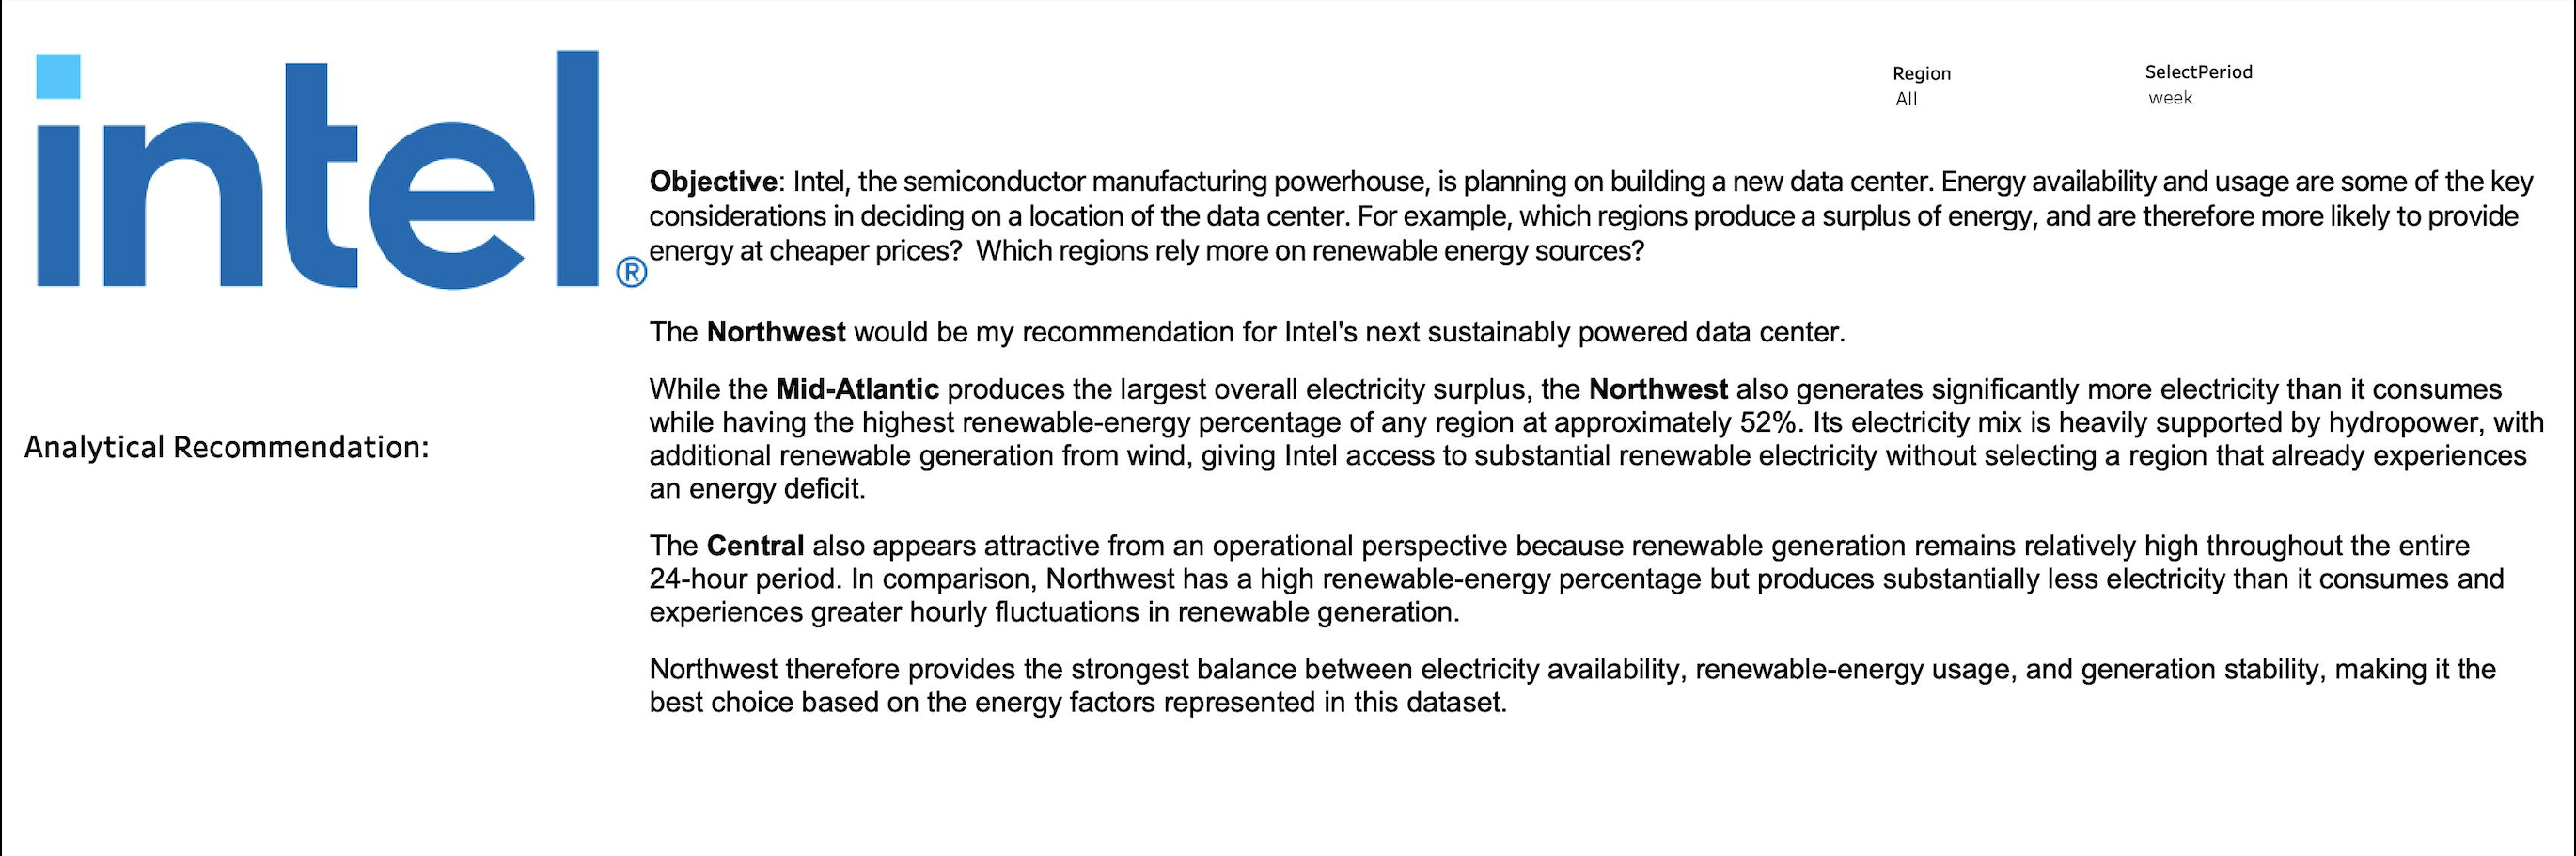
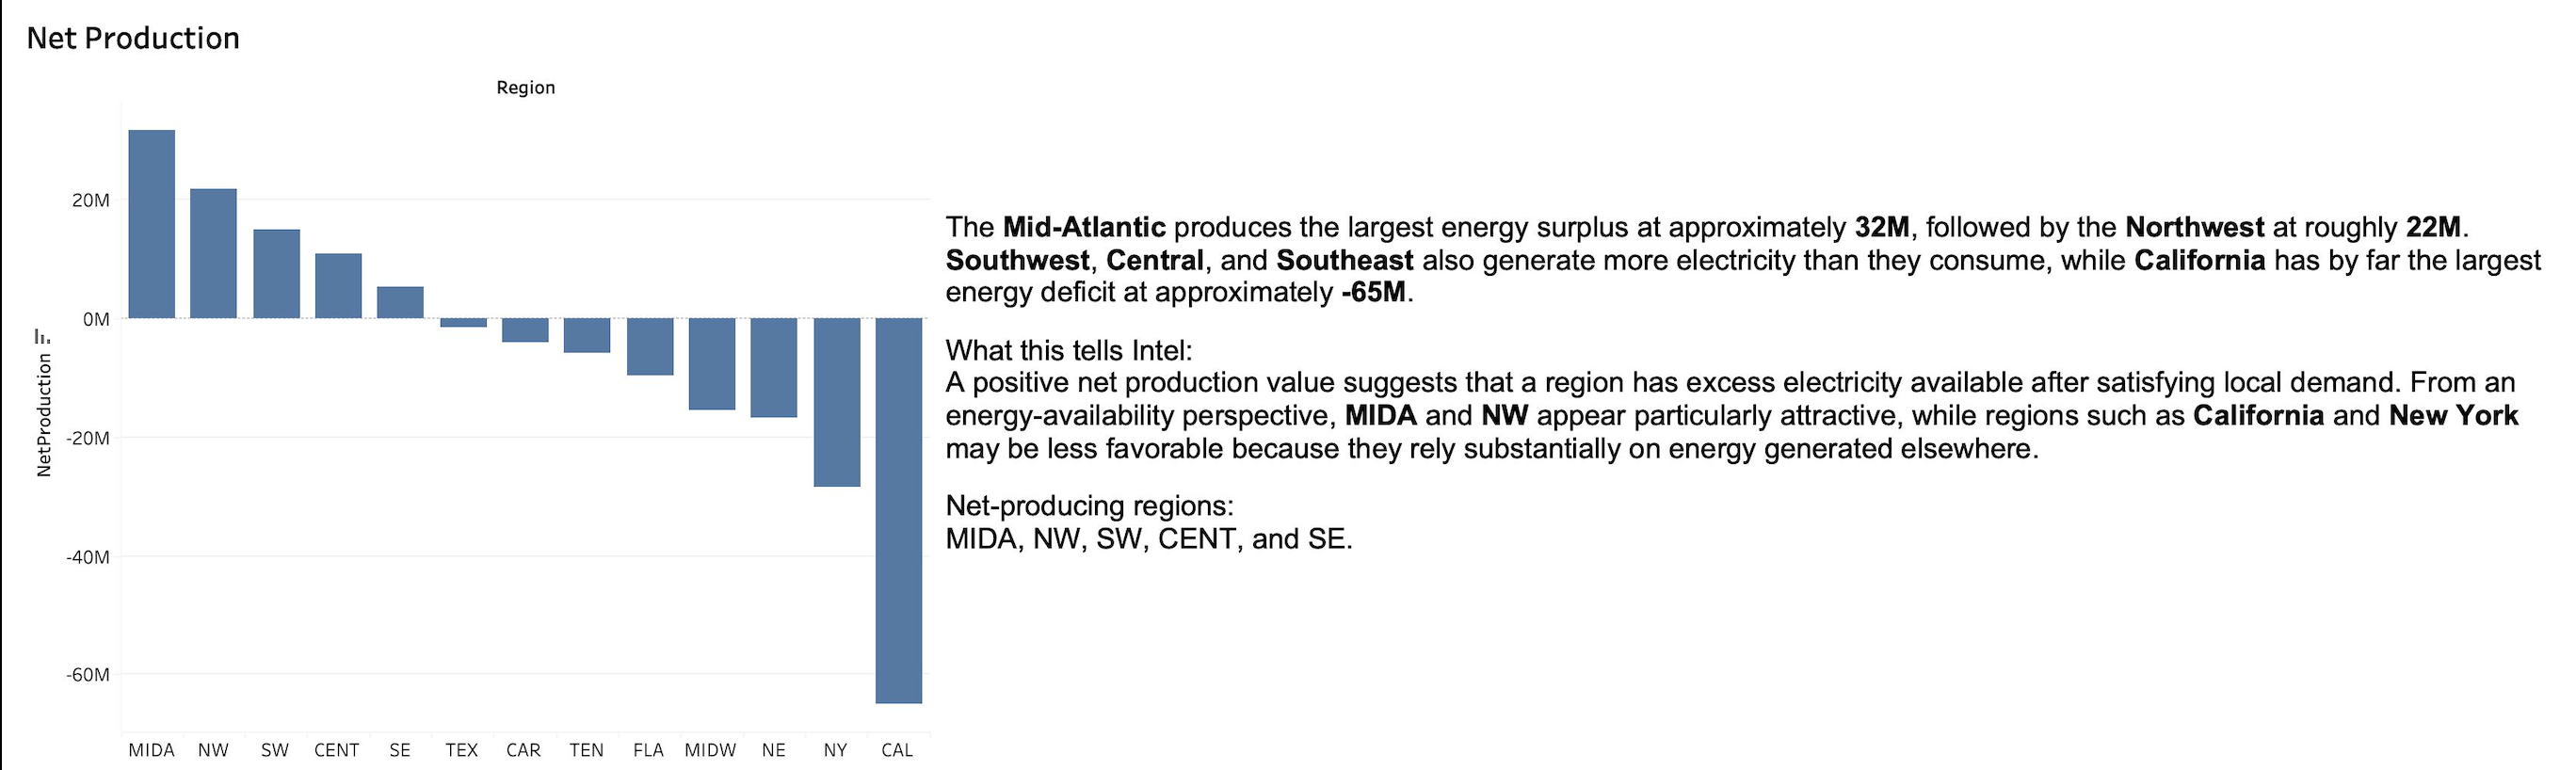
Benchmarked U.S. energy markets to recommend where Intel should build its next data center — the Northwest, backed by the data.

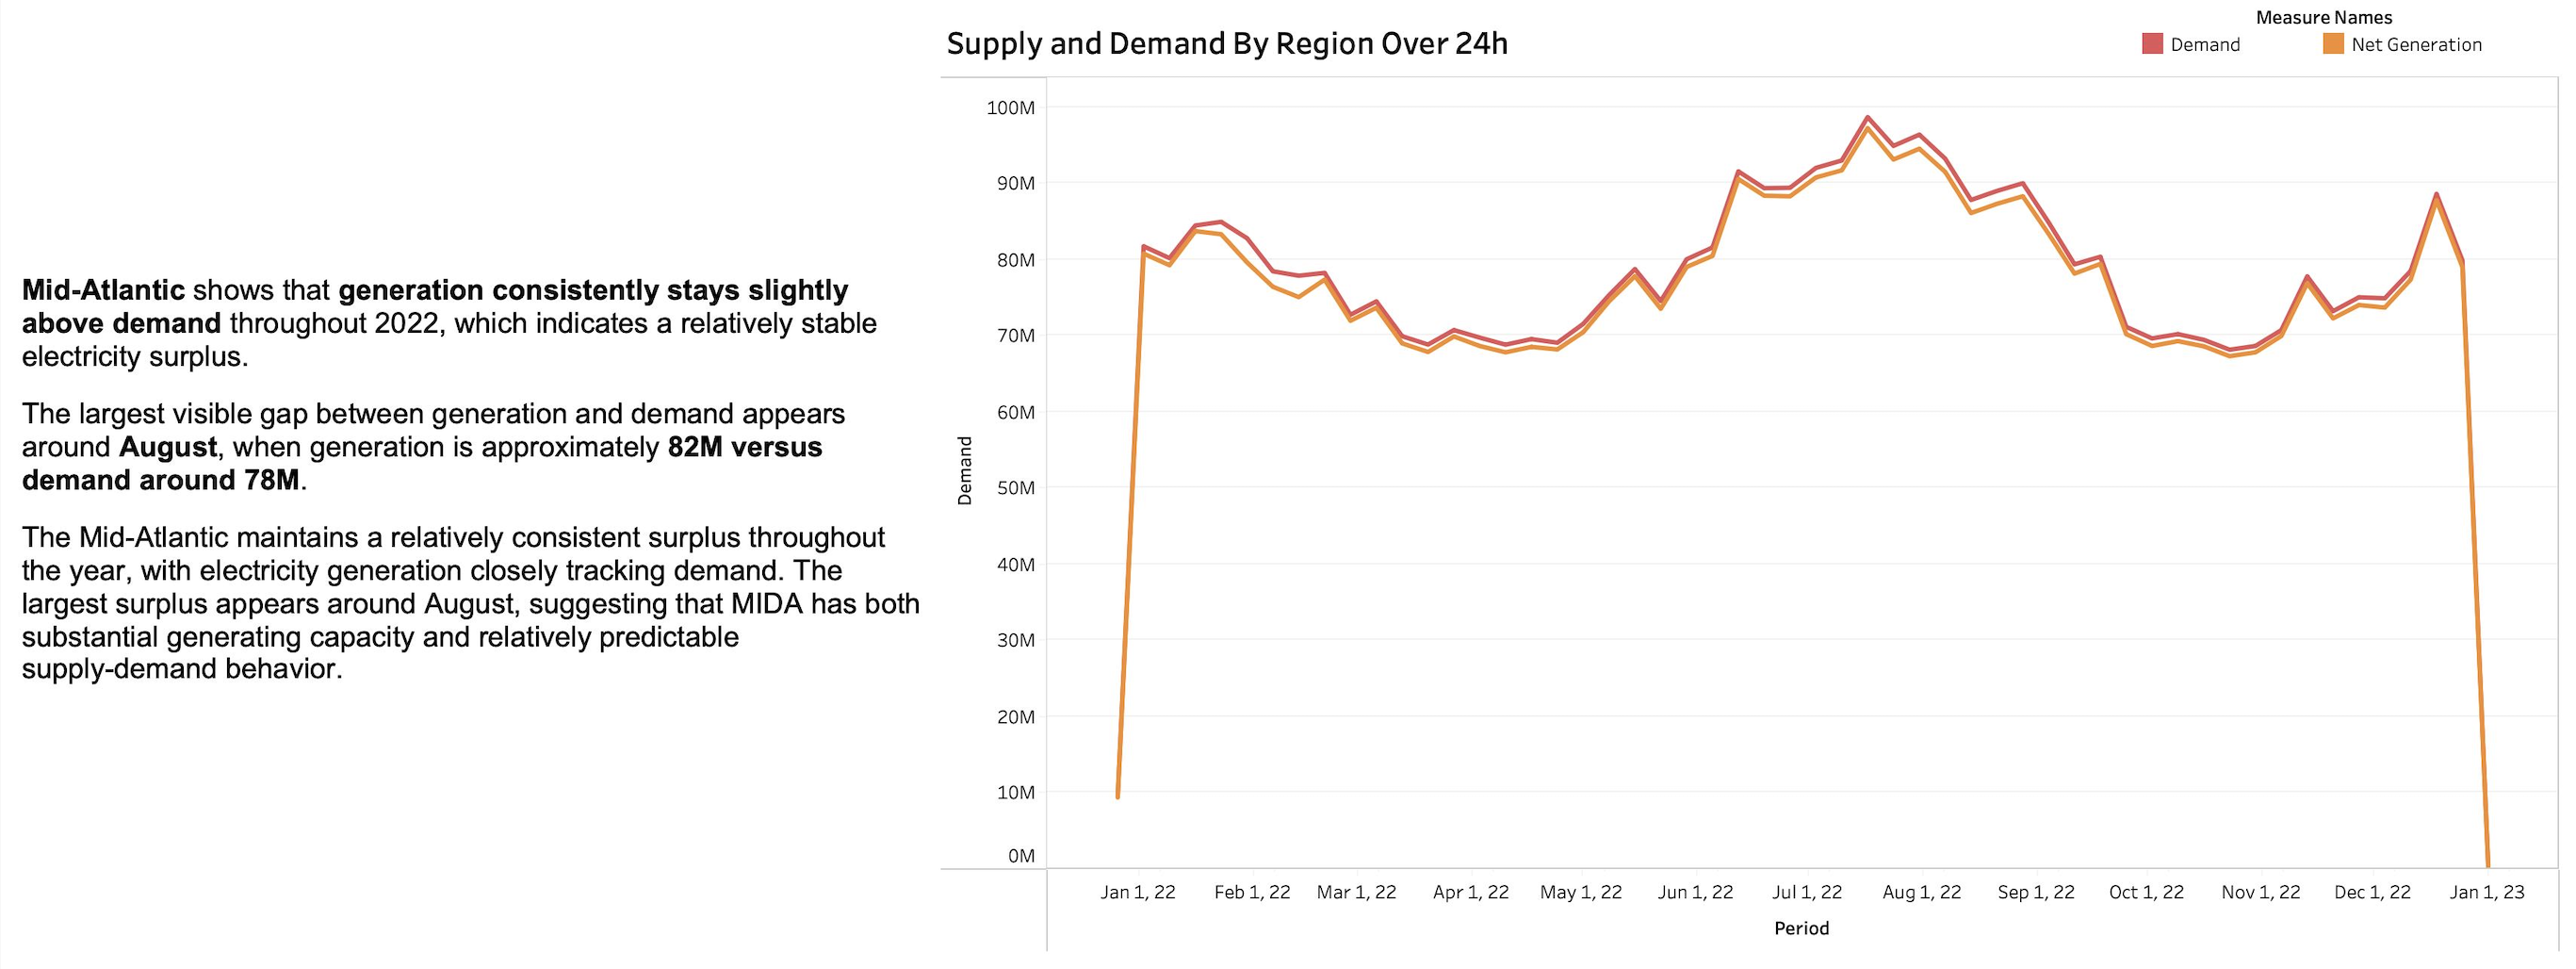
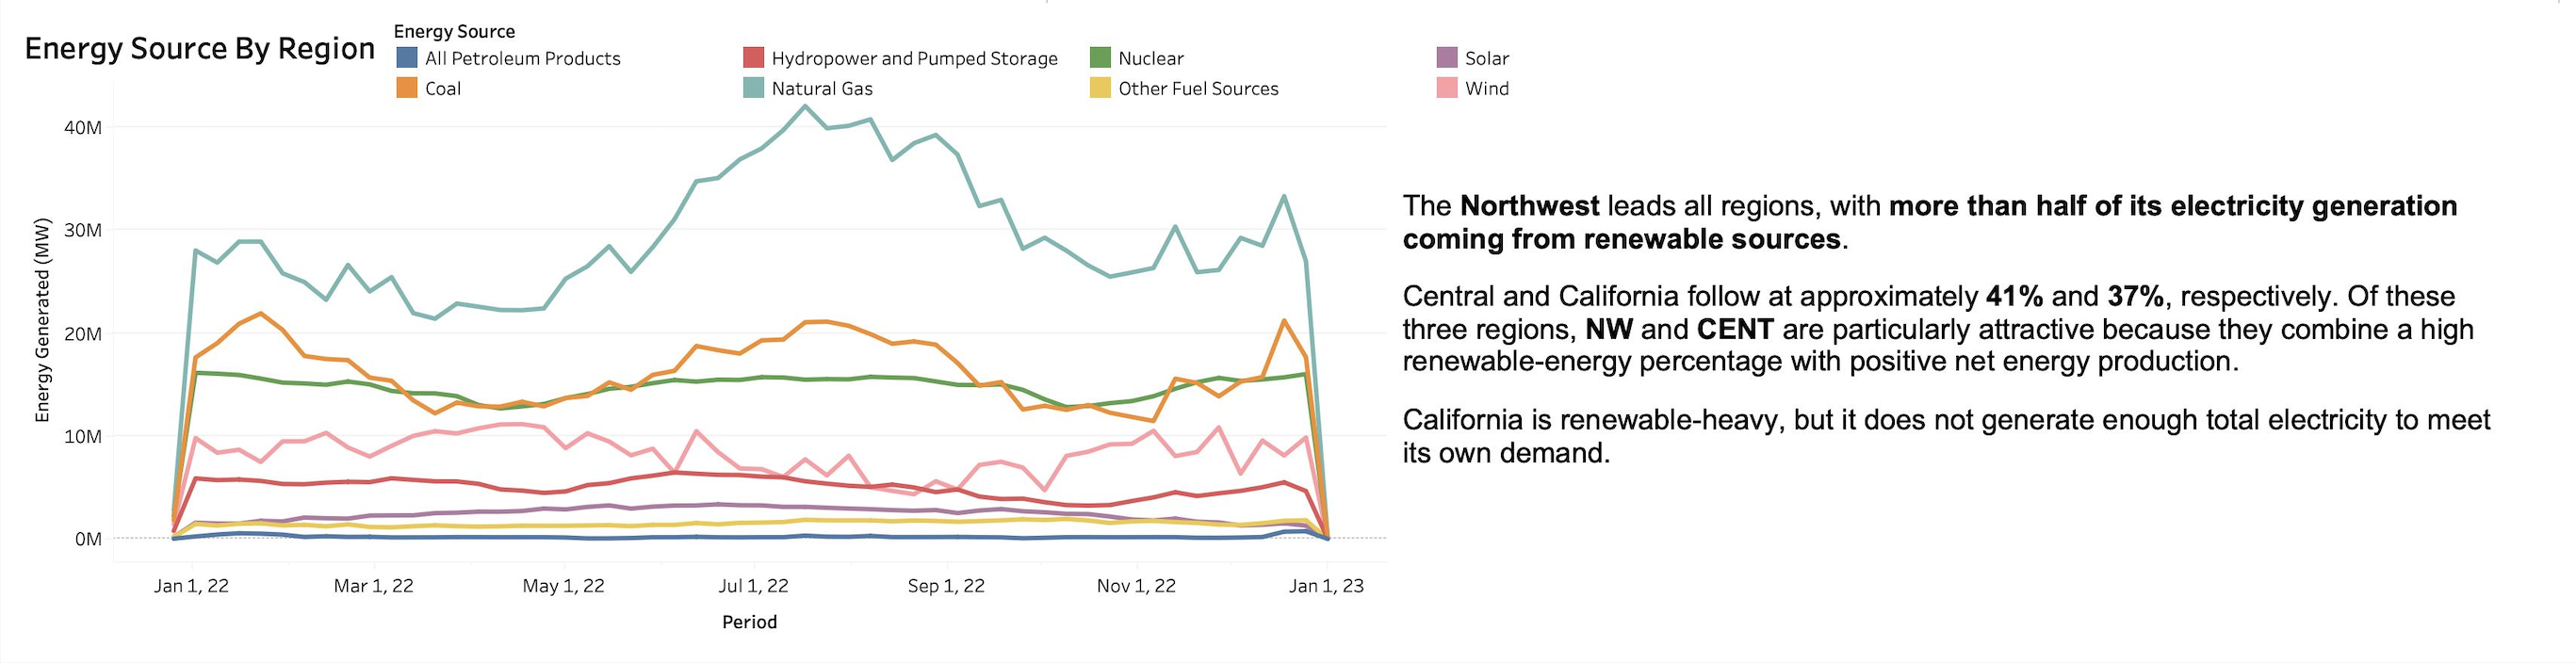
Intel needed a defensible answer to where its next data center should go. I queried and transformed large-scale federal energy datasets in SQL — net production, renewable share, hourly generation patterns — and benchmarked regions head-to-head.

The deliverable: interactive Tableau dashboards the Sustainability team could explore by region, source, and time period, backed by a formal written recommendation — the Northwest — with the data to defend it.

Data
Federal, large-scale
Method
SQL + time-series
Output
Dashboards + memo
Call
Northwest
SQLTableauTime-seriesBenchmarking

CarMax Analytics Showcase

Team project · INFO 320 Artificial Intelligence For Business · VCU · Fall 2024
PROJ_04

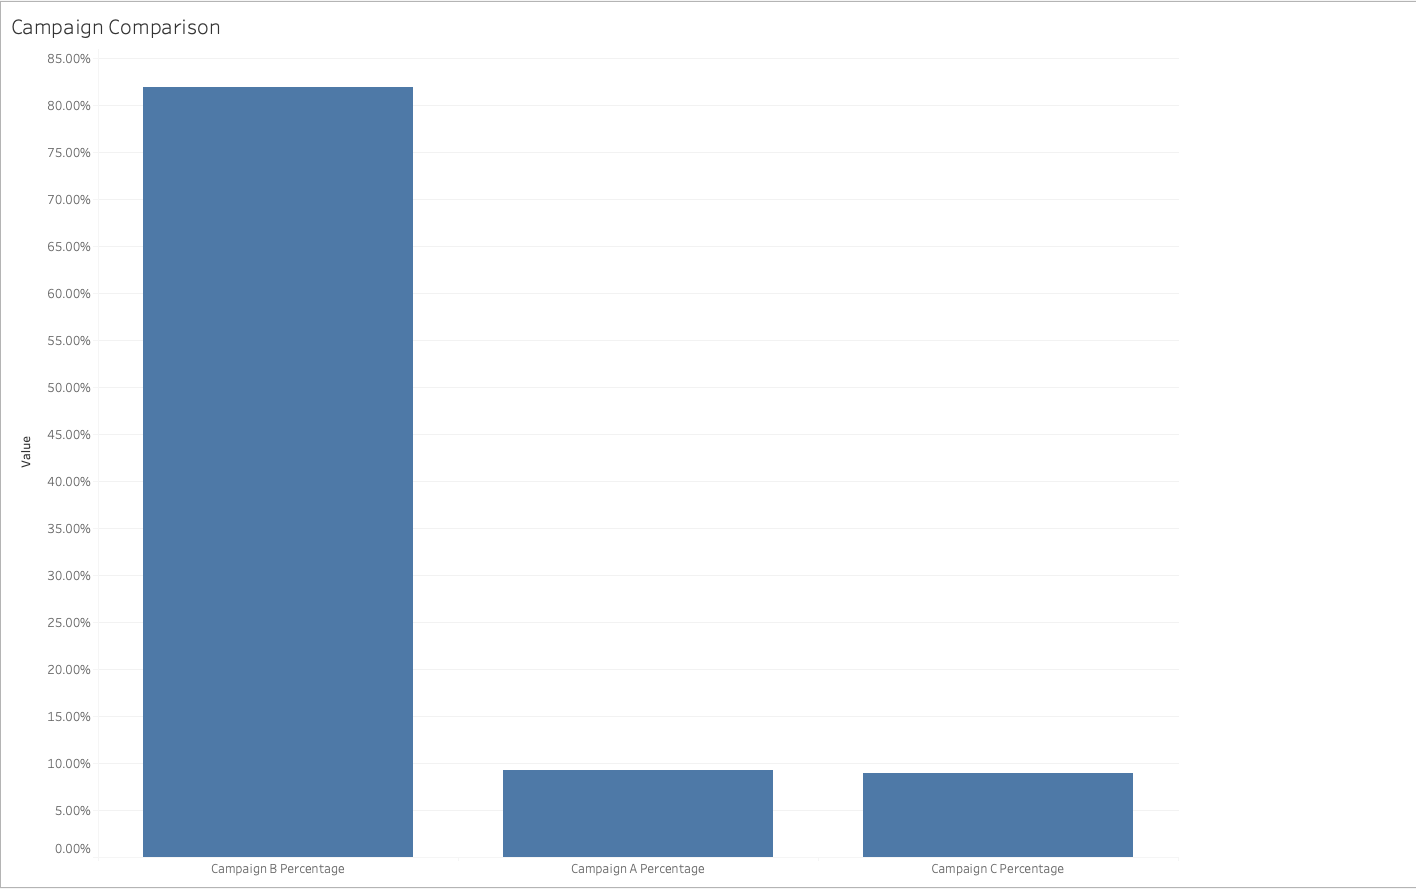
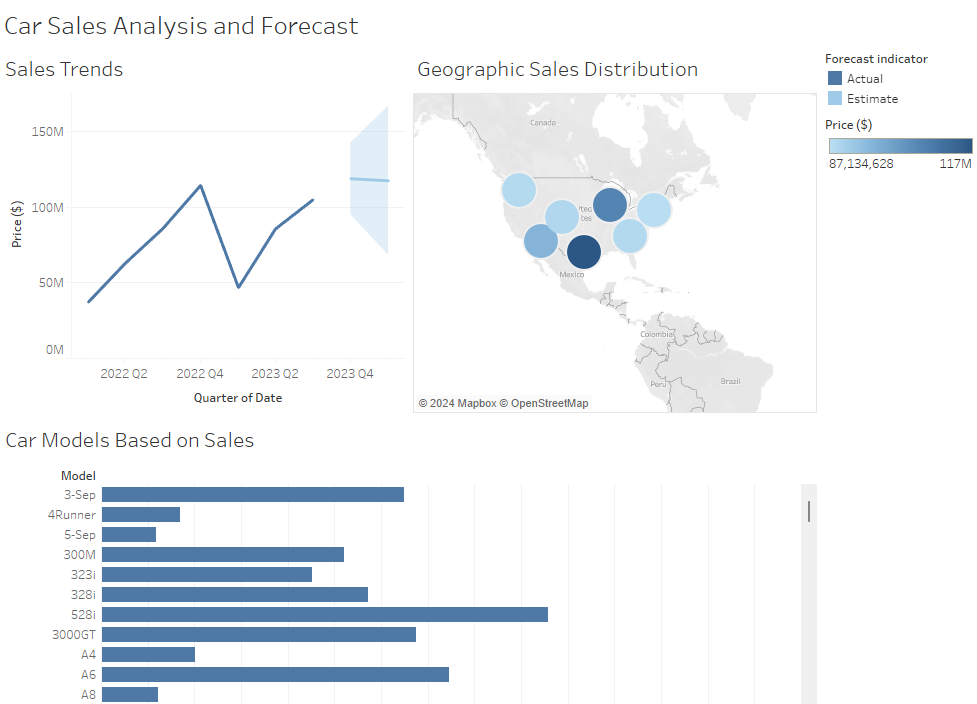
Found that one marketing campaign was driving roughly 81% of CarMax's conversions on its own, and where to expand next.

Four-person team, brief from CarMax: find where marketing and inventory strategy could drive more sales as the company keeps opening more locations. I worked the market segmentation and campaign analysis end of it.

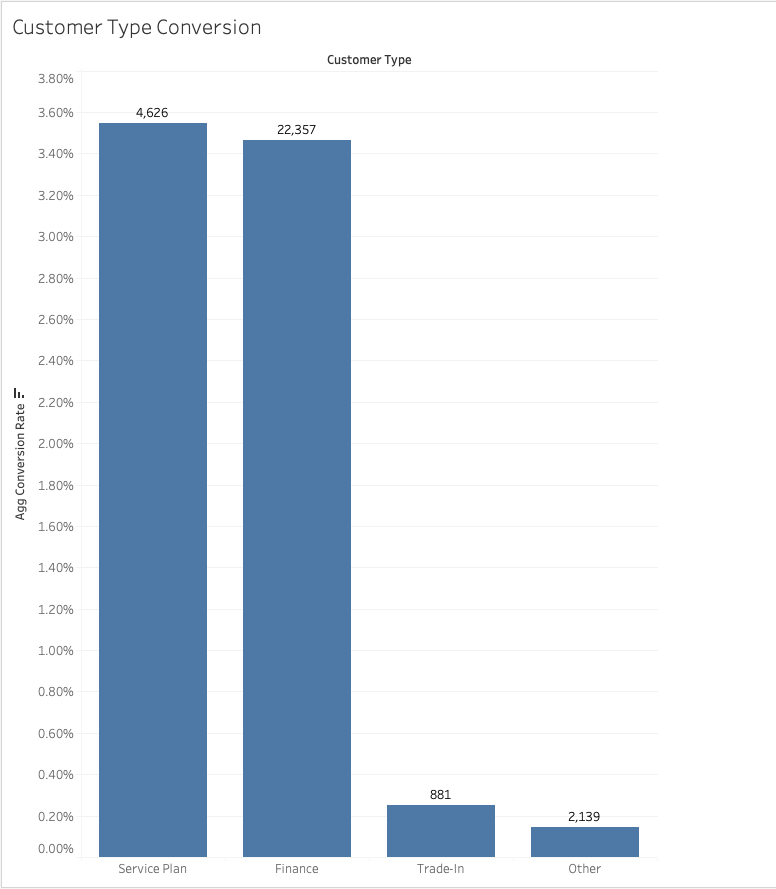
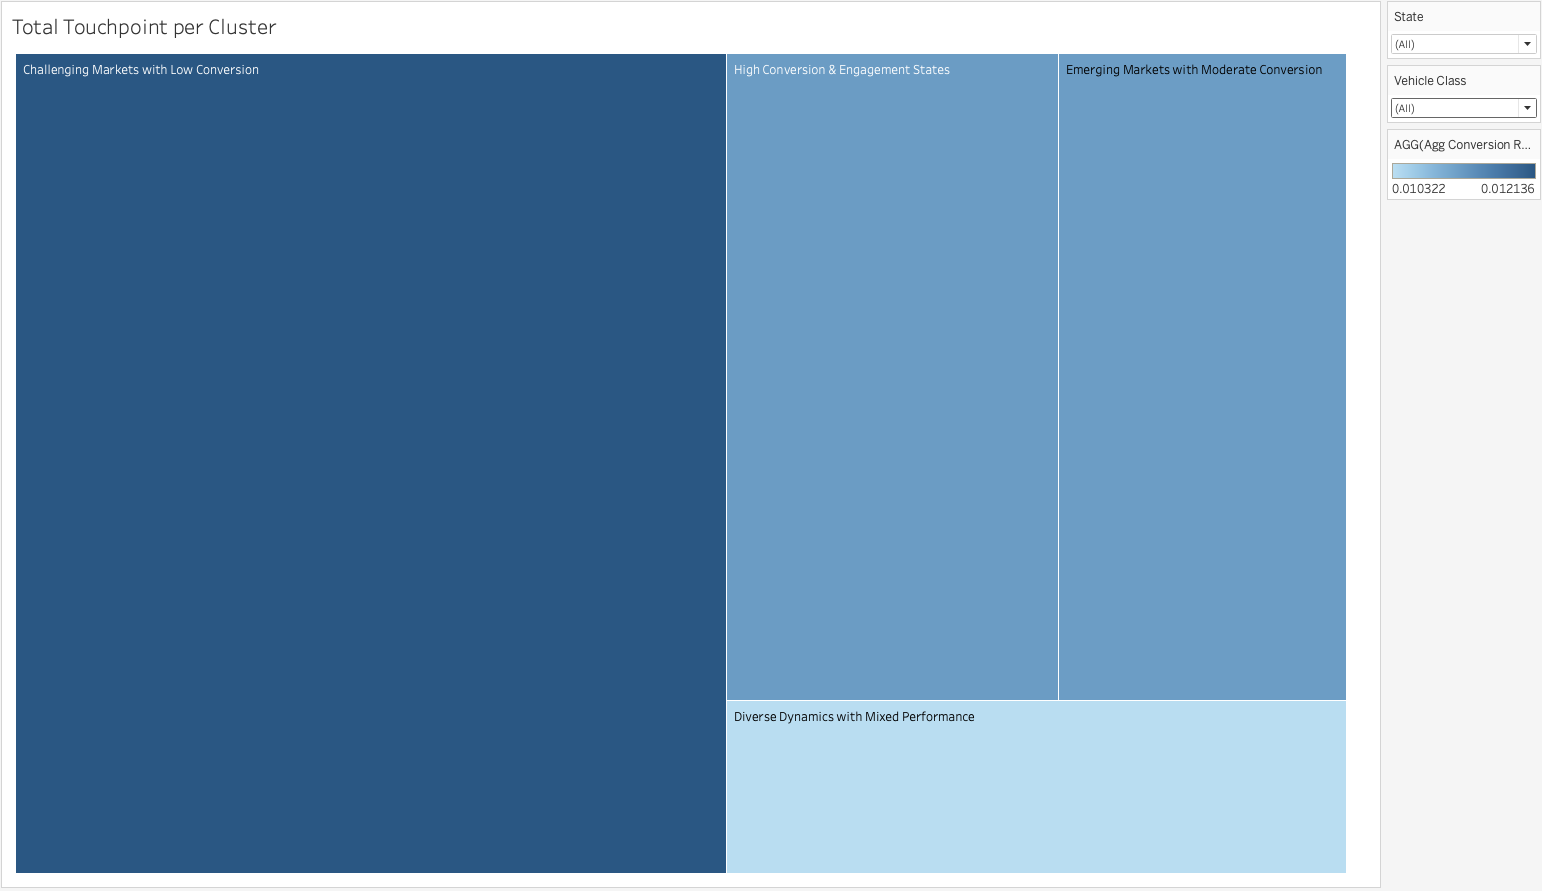
We cleaned and joined the data in Tableau Prep and Knime, then built out conversion analysis in Tableau across four customer touchpoint clusters. The clearest signal: conversion was highest in the Southwest (CA, NV, AZ, CO) and Southeast (VA, NC, SC, FL), and one campaign — Campaign B — was driving roughly 81% of conversions on its own, more than eight times either of the other two combined.

Our recommendation: lean into Campaign B with a focus on family-oriented vehicles — small and medium SUVs, compact cars — expand marketing and inventory toward the high-conversion Southwest and Southeast regions, and give the lowest-performing cluster a distinct strategy instead of a one-size-fits-all push.

Top campaign
Campaign B, ~81%
Best regions
SW & SE
Segments
4 clusters
Team
4-person
TableauTableau PrepKnimeMarket segmentationCampaign analysisRegional analysis

Predictive Sales Model

Automotive sales forecasting · VCU · Sep–Dec 2024
PROJ_05

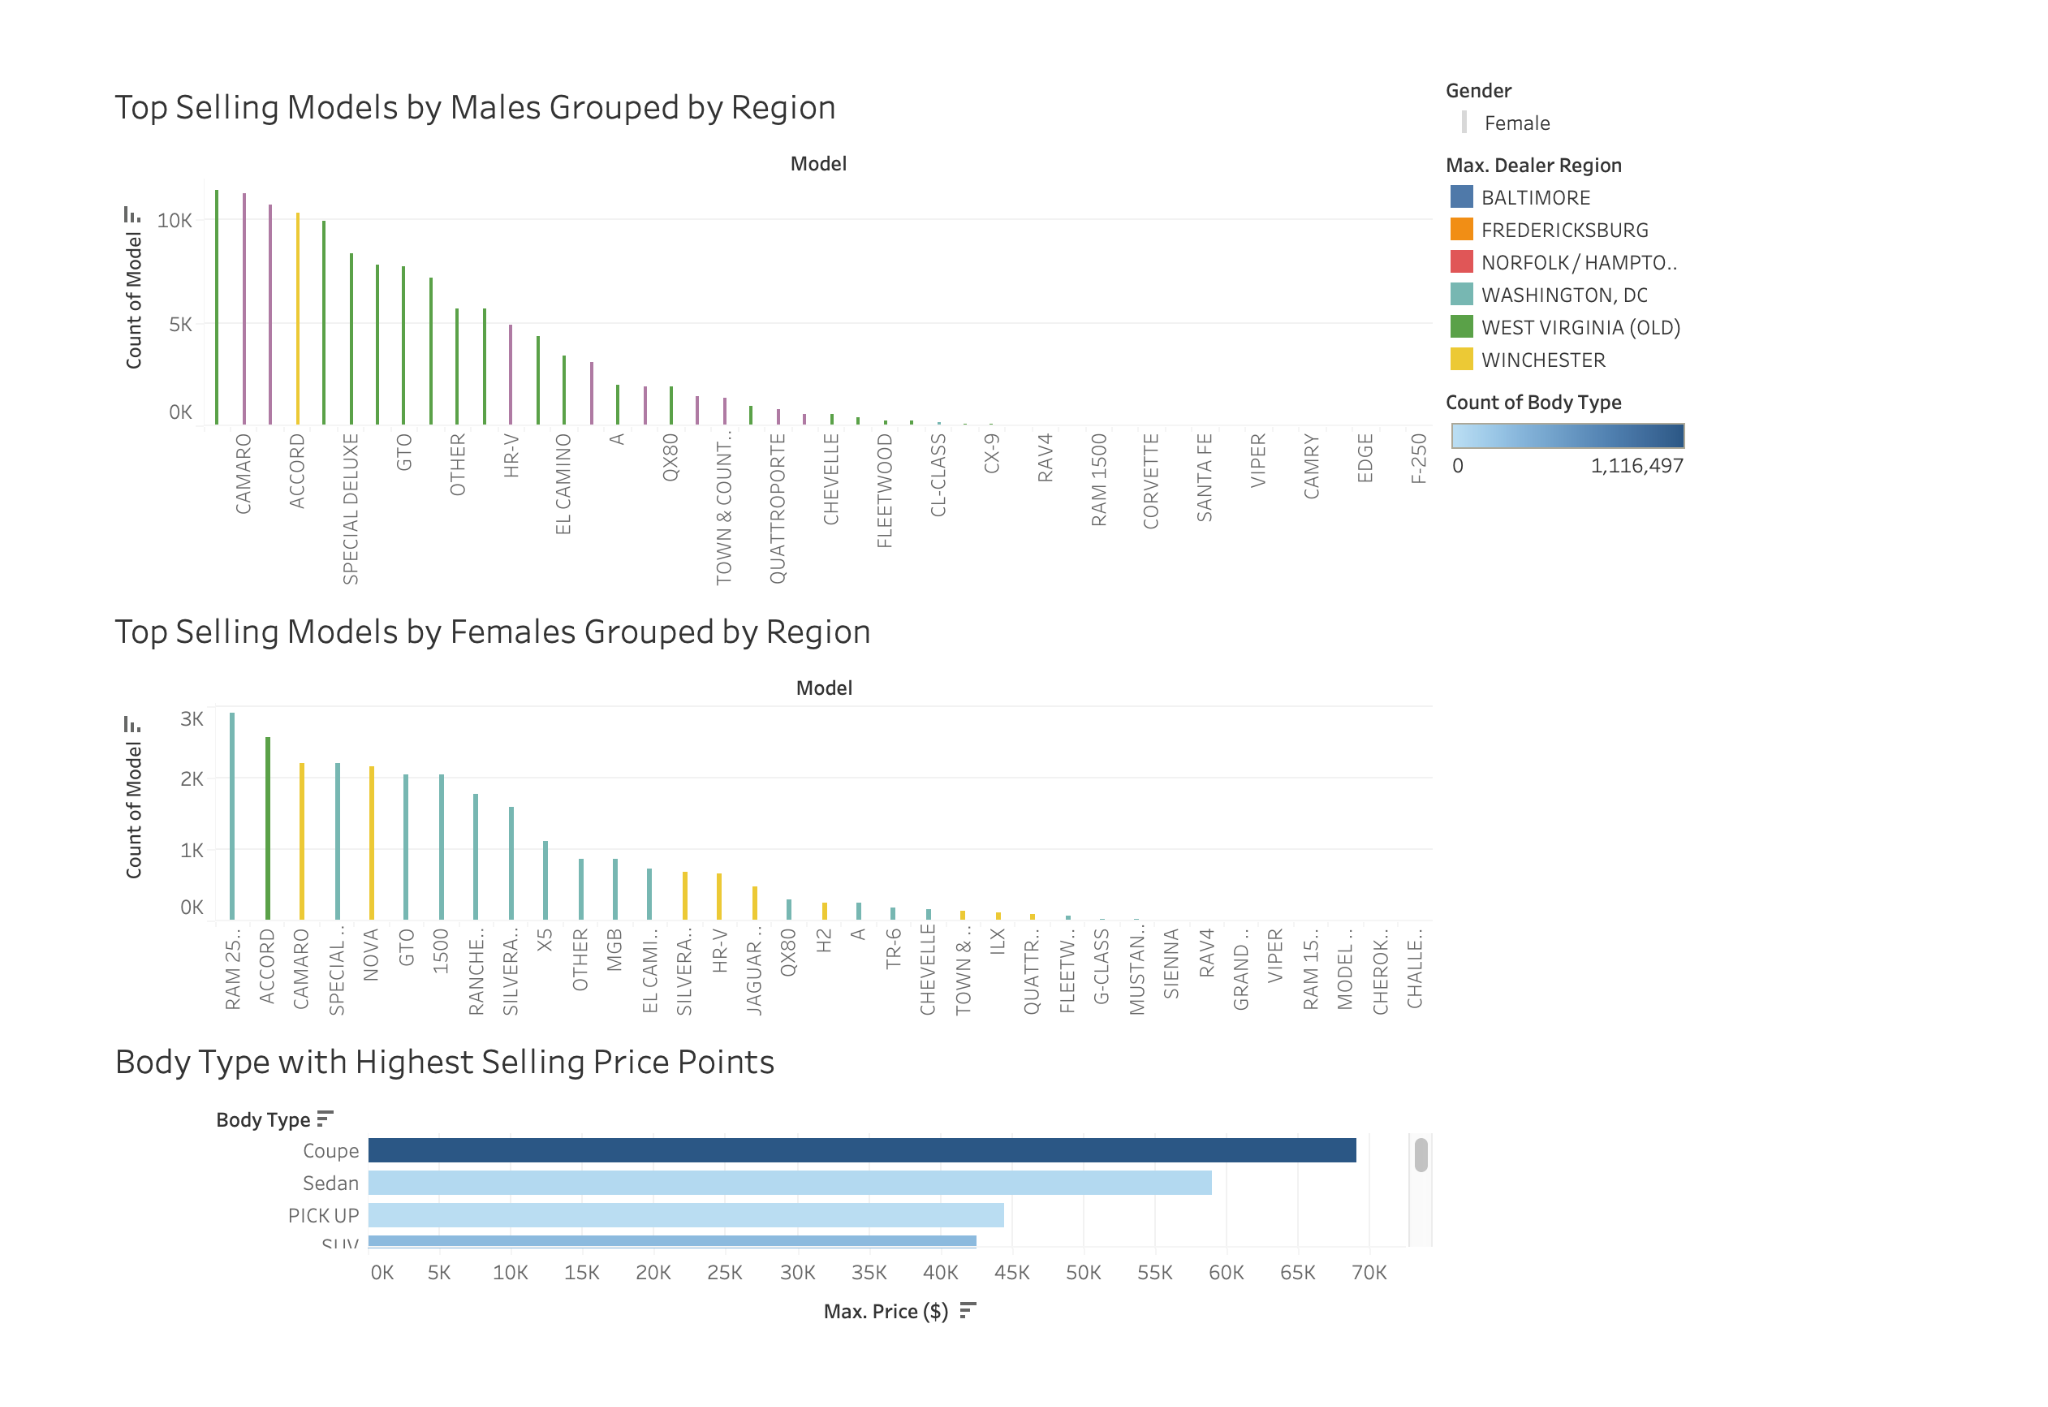
Built persona-specific forecasting dashboards for an auto dealership network that lifted forecast accuracy by more than 25%.

Four-person team, four two-week sprints: build a predictive model for automotive dealership sales and turn it into dashboards different stakeholders could actually use, not just one generic report. I led the sprint planning and owned the modeling.

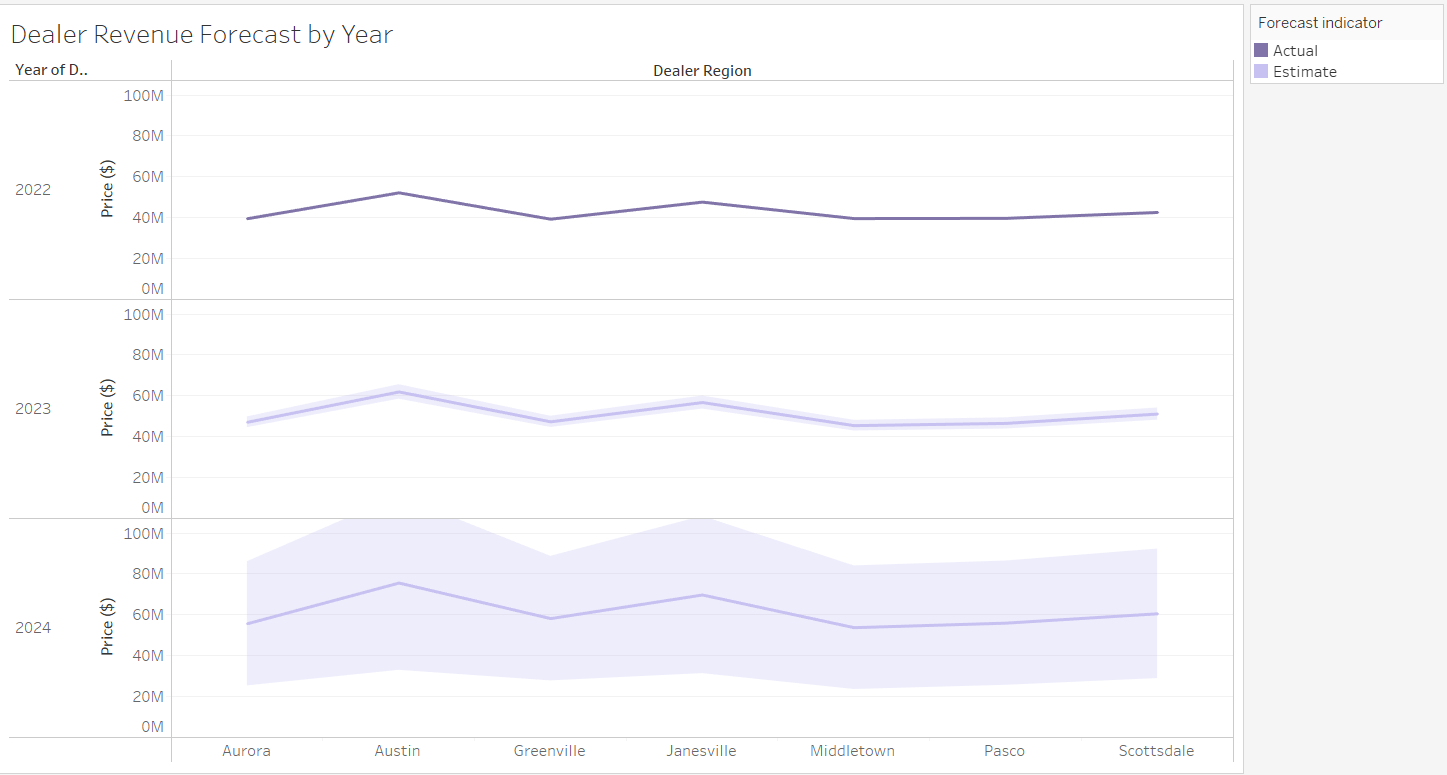
Instead of shipping a single dashboard, we built persona-specific Tableau views: Regional Sales Managers get revenue forecasts by year with confidence intervals and county-level maps; Finance gets quarterly sales trends, top-selling models, and regional distribution; Senior Executives get model preference by gender and which body types carry the highest price points — coupes topped out around $68K, ahead of sedans, pickups, and SUVs. Forecast accuracy improved by more than 25% across the iterations, and the work produced 14 actionable insights along the way.

I owned the backlog, wrote the sprint plans, and ran retrospectives while carrying the modeling work myself. The retrospectives ended up doing as much for accuracy as the model did — each one turned into a concrete change we shipped the next sprint.

Accuracy gain
+25%
Insights
14
Sprints
4
Role
Lead
PythonTableauAgile/ScrumPredictive modelingStakeholder dashboards

Supply Chain Analytics Hub

Amazon · ATL6 Sorting Center · Summer 2022
PROJ_06

Built Amazon's ATL6 performance analytics hub from scratch, lifting satisfaction 20% and productivity 15%.

Operations leadership at ATL6 had no consolidated view of their own performance data. I gathered requirements from HR and Operations, built an analytics hub to close that gap, then trained the managers who'd rely on it day to day.

Employee satisfaction rose 20% and productivity metrics improved 15%. Separate workforce analyses I ran across the 1,000+ associate site fed into planning that lifted regional retention by 10%. I presented the finished prototype directly to NASC executives, who evaluated it for a nationwide rollout.

Site scale
1,000+ assoc.
Satisfaction
+20%
Productivity
+15%
Retention
+10%
Data analysisRequirementsDashboardsExec presentation

ASOS Revenue Analysis

Python data-cleaning exercise · Global Career Accelerator · Jul 2024
PROJ_07

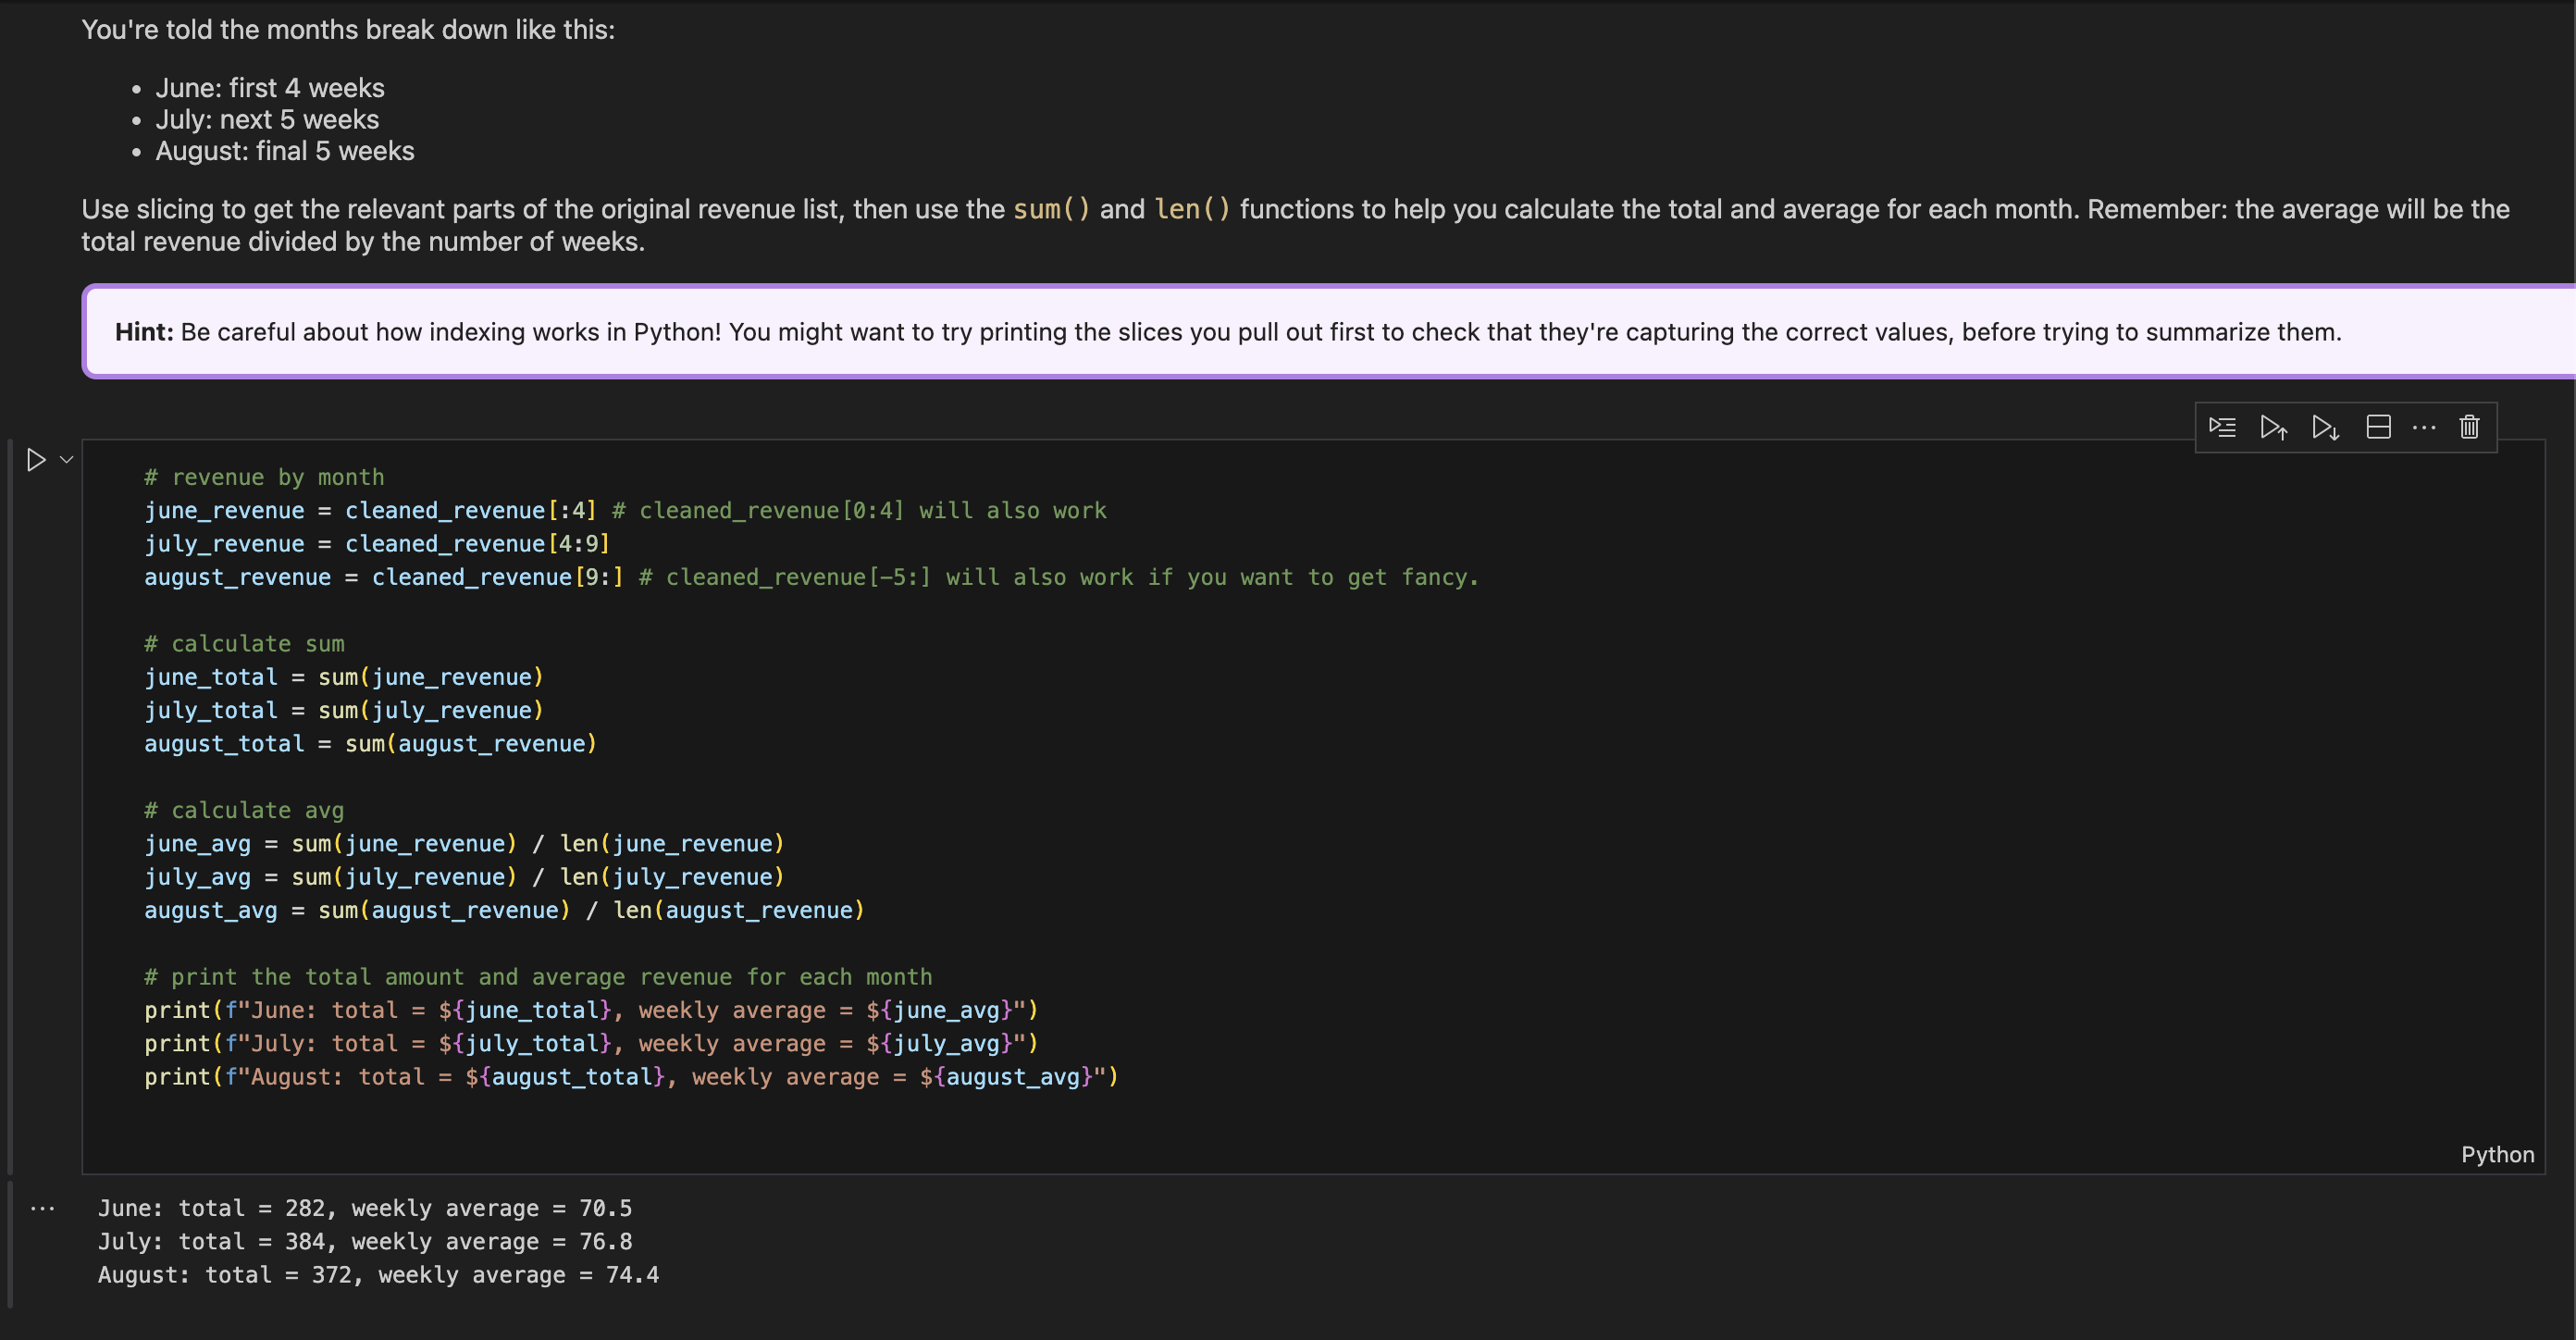
A data-cleaning exercise: turned messy revenue figures into clean monthly totals and found July as the strongest month.

A guided data-cleaning and analysis exercise from the Global Career Accelerator program. ASOS's weekly revenue figures came in as a mix of strings and integers in the same list — the kind of small, deliberate mess that forces real handling of type coercion before any actual analysis can run.

I converted the mixed-type data, sliced it into June, July, and August, and calculated weekly totals and averages for each month. July came out on top at a $76.8M weekly average against $70.5M in June and $74.4M in August — a useful drill in going from clean numbers to an actual takeaway leadership could act on.

Dataset
14 weeks
Top month
July, $76.8M/wk
Skills
Type coercion, slicing
Program
Global Career Accelerator
ASOS notebook output: cleaned revenue data, monthly totals, and averages
Notebook: cleaned data & monthly averages
PythonData cleaningType coercionList slicingDescriptive statistics
03

Stack

what I reach for

Data & query

  • SQL
  • Python
  • Google BigQuery
  • Jupyter / JupyterHub
  • Oracle APEX
  • MongoDB

Visualization

  • Tableau
  • Power BI
  • Advanced Excel
  • Knime

AI tooling

  • Agentic workflows
  • Claude
  • ChatGPT
  • LLAMA
  • Transcript analysis

Cloud & infra

  • AWS — VPC, EC2
  • Security groups
  • Load balancers
  • Node.js
  • REST APIs

Process

  • Agile / Scrum
  • Requirements & user stories
  • QA & validation
  • Process documentation

Platforms

  • Salesforce
  • SAP GUI
  • Intercom
  • Microsoft 365
  • Thoughtly
04

Work history

since 2021
Jul 2025 — present

Enrollment Advisor, Registration Operations

Podium Education

Primary point of contact for 15 university partner accounts. Built PRAXIS and Trubbish from the ground up. Audit and reconcile enrollment data across every partner; enrollment work I led generated $30,000 in revenue over a single 4.5-week stretch.

Jan 2024 — Jul 2025

Senior Team Lead, Academic Operations

Podium Education

Led four associate team leads to consistent 80–100% goal attainment. Owned QA across dashboards and data pipelines, authored the team's process documentation, and drove a workflow overhaul that lifted customer satisfaction 45% in a single product cycle.

Feb 2021 — present

Long-Term Substitute Teacher

Loudoun County Public Schools

Delivered curriculum across long- and short-term assignments at Broad Run High School, repeatedly requested back by name for future placements. Supported students with a wide range of academic, behavioral, and social-emotional needs.

Jun — Aug 2022

Sr. HR Business Partner Intern

Amazon

Built the ATL6 Supply Chain Analytics hub from scratch. Ran workforce analyses across 1,000+ associates and presented findings directly to NASC executives.

May 2025

B.S. Information Systems & Technology

Virginia Commonwealth University — Snead College of Business

Coursework spanned Business Intelligence & Data Mining, Database Systems, Systems Analysis & Design, Business Process Engineering, and IT Infrastructure. CSPO certification in progress, expected September 2026.